Project:
In today's world, displaying information in the form of infographics is a common practice. Students will be creating an infographic based off of their own personal
data. Using Adobe InDesign, Photoshop, Illustrator, to create a 8x14 Infographic
using your own personal data and visual representation of data. When students
create infographics, they are using information, visuals, and technology.
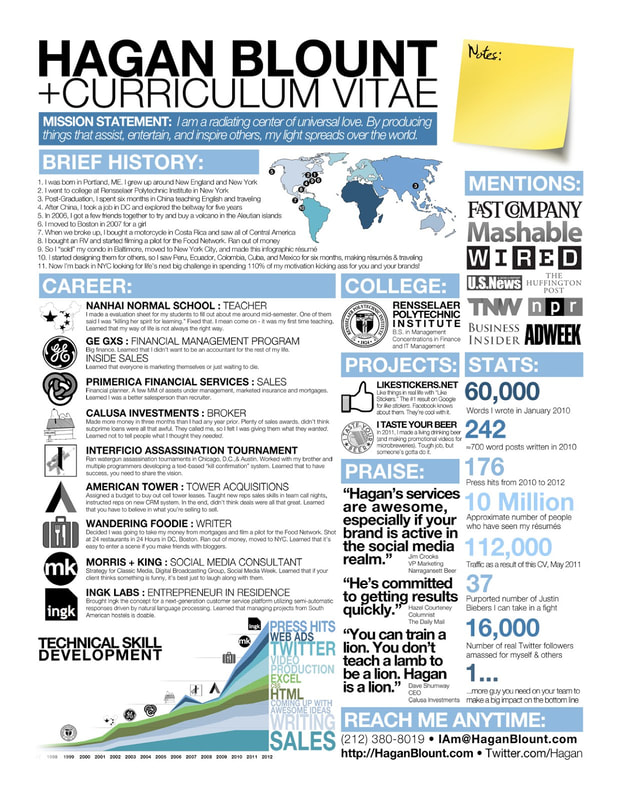
Information graphics or infographics are visual representations of information,
data or knowledge. These graphics are used where complex information needs to
be explained quickly and clearly, such as in posters, editorial design, signs, maps, technical and educational. They’re also used extensively as tools by educators, marketers, journalists, scientists, and statisticians to ease the process of developing and communicating conceptual information.
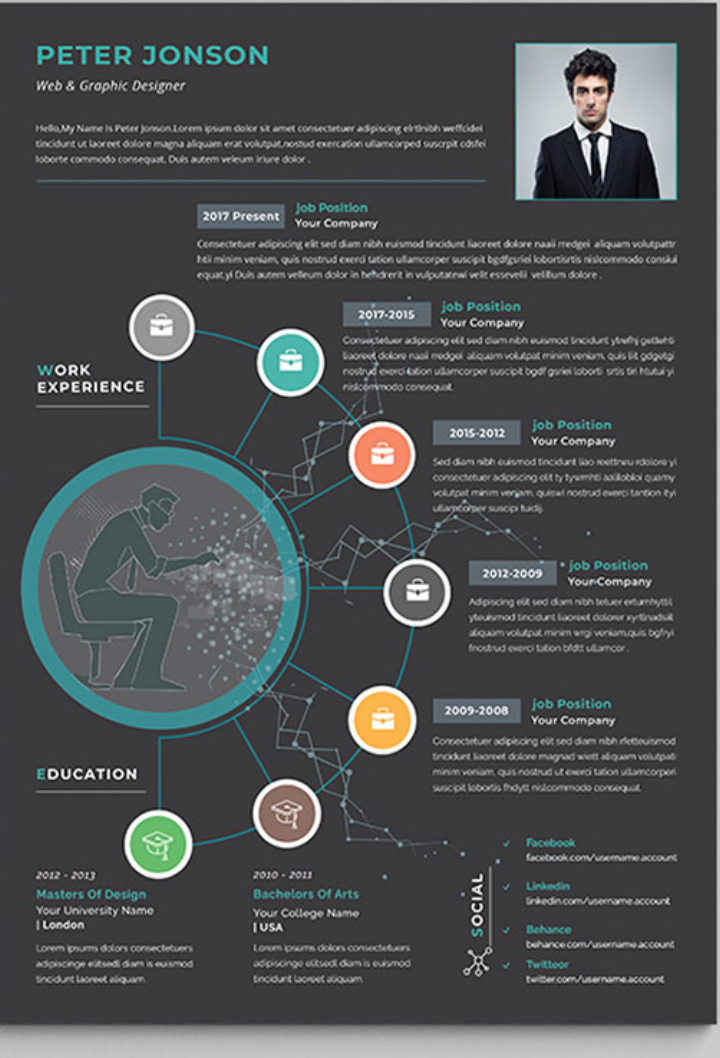
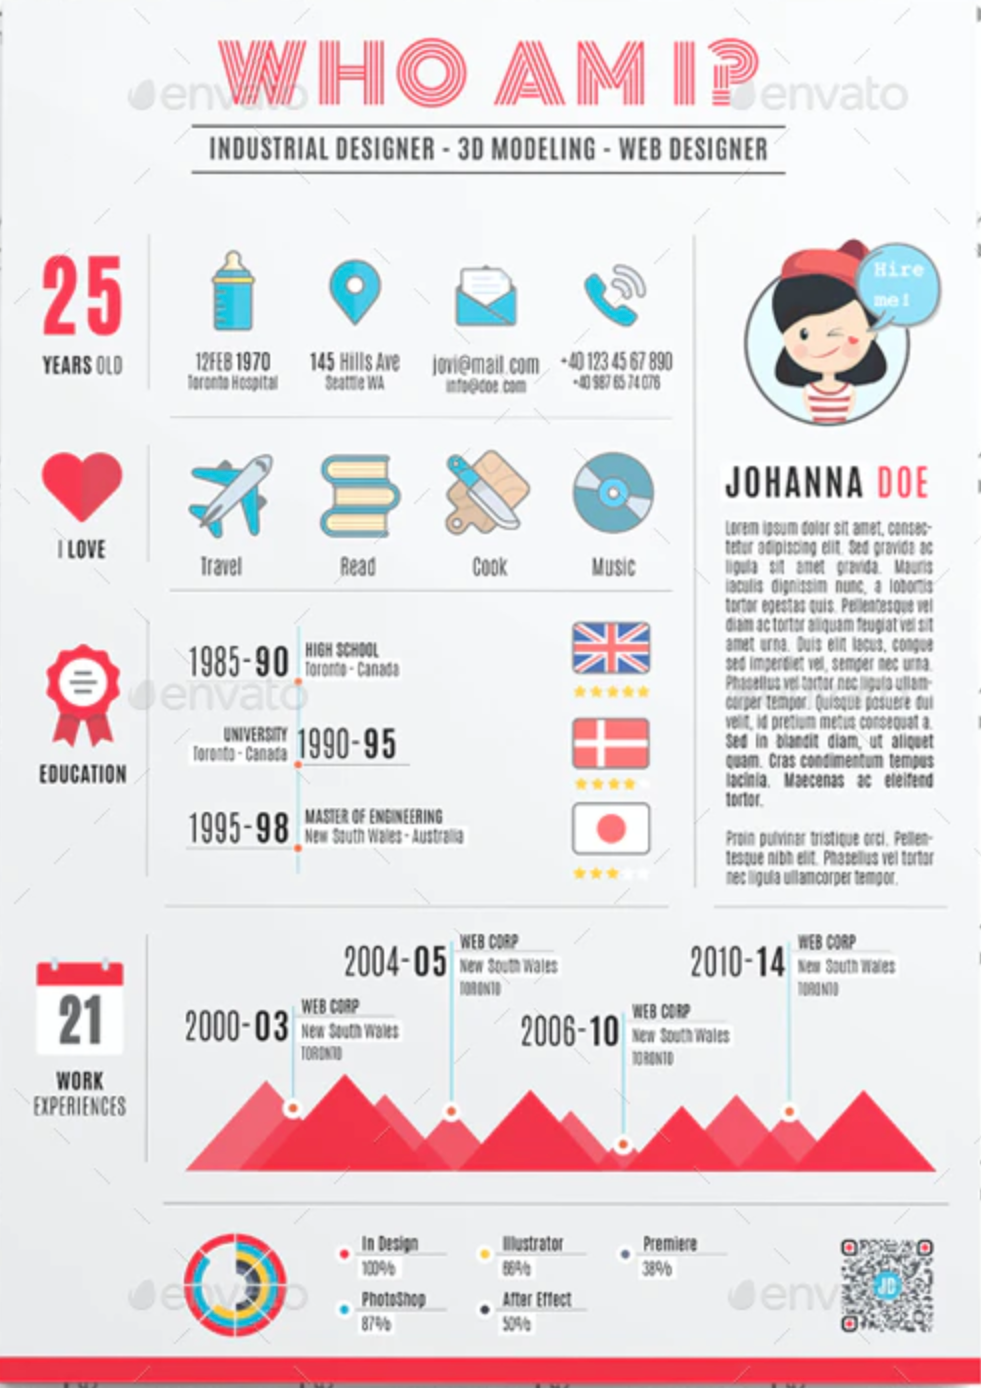
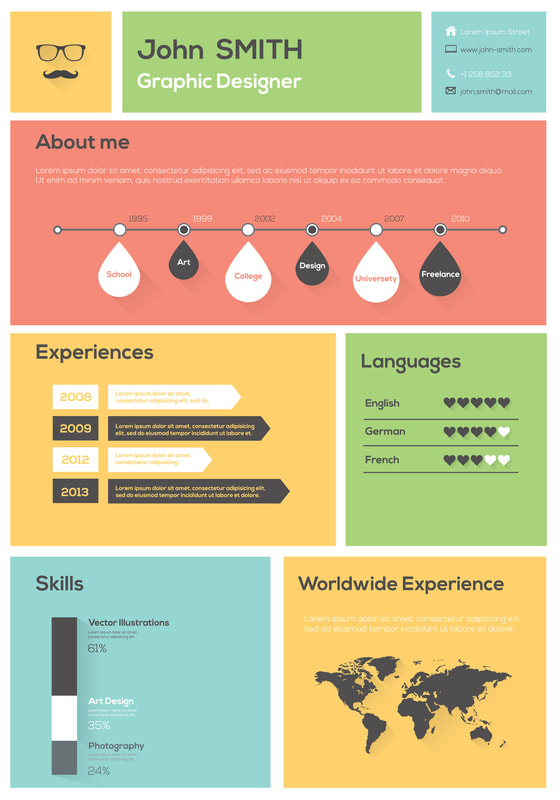
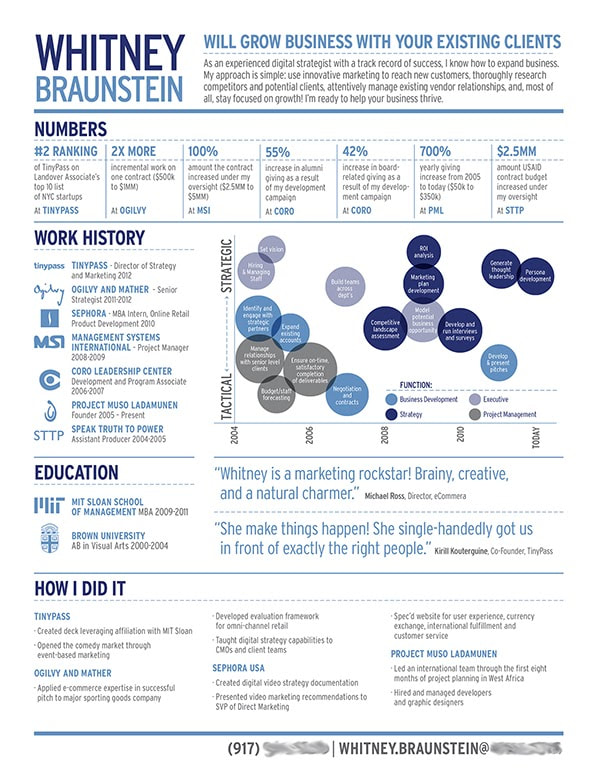
An Infographic:
Artists to Look At:
Paula Scher https://www.behance.net/PaulaScher
Eddie Opara https://www.pentagram.com/work
Pentagram (Design Studio) https://www.pentagram.com/work
Massimo Vignelli http://www.designculture.it/interview/massimo-vignelli.html
Saul Bass https://www.artofthetitle.com/designer/saul-bass/
Gail Anderson https://gailycurl.com/
Sylvia Harris https://www.aiga.org/design-journeys-sylvia-harris
Lesson (What are we learning by doing this project?):
Demonstrate the importance of research, sketching ideas, the use of appropriate visual references
Visual Hierarchy- creating laying out elements logically and strategically
Skillfully create images using tools in Photoshop and illustrator.
Skillfully use InDesign, Illustrator and Photoshop together
Combine multiple file types
Use color, text and images to create a visual design
STEPS:
In today's world, displaying information in the form of infographics is a common practice. Students will be creating an infographic based off of their own personal
data. Using Adobe InDesign, Photoshop, Illustrator, to create a 8x14 Infographic
using your own personal data and visual representation of data. When students
create infographics, they are using information, visuals, and technology.
Information graphics or infographics are visual representations of information,
data or knowledge. These graphics are used where complex information needs to
be explained quickly and clearly, such as in posters, editorial design, signs, maps, technical and educational. They’re also used extensively as tools by educators, marketers, journalists, scientists, and statisticians to ease the process of developing and communicating conceptual information.
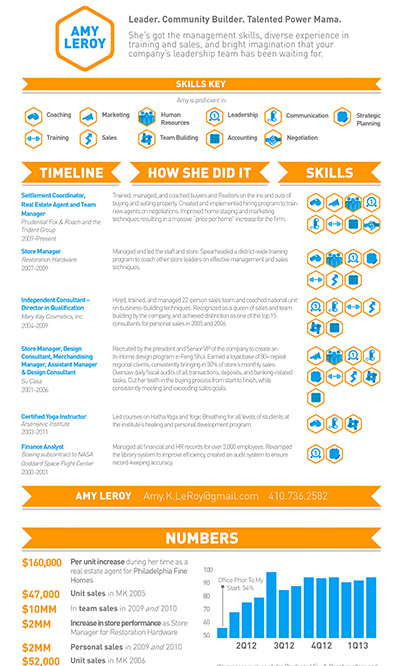
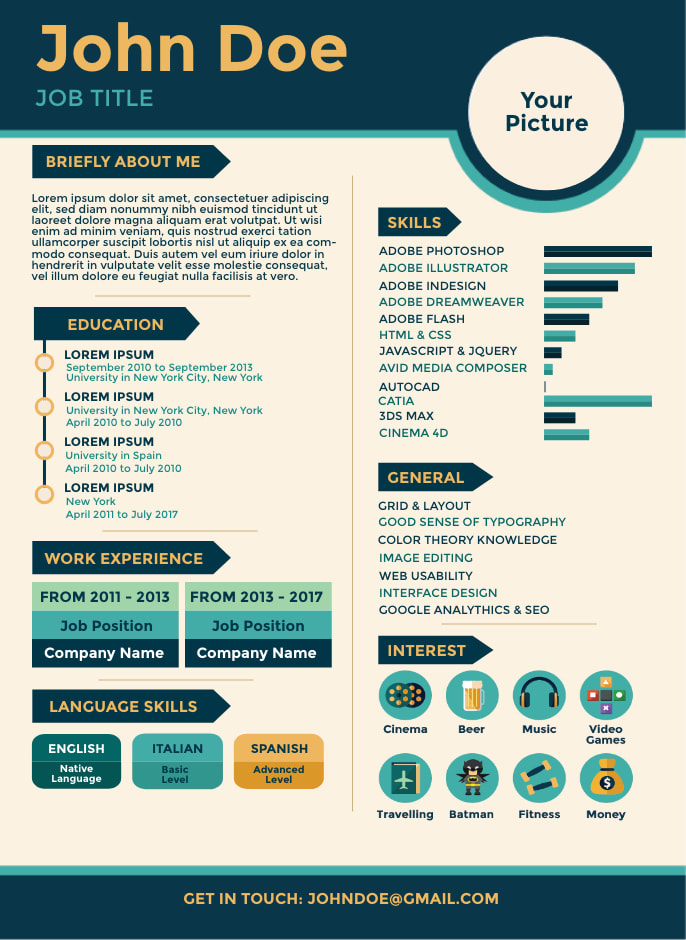
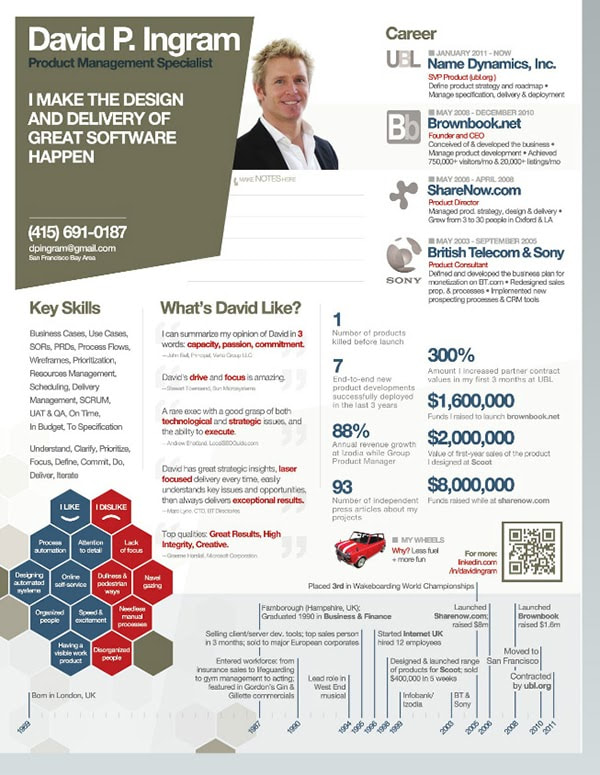
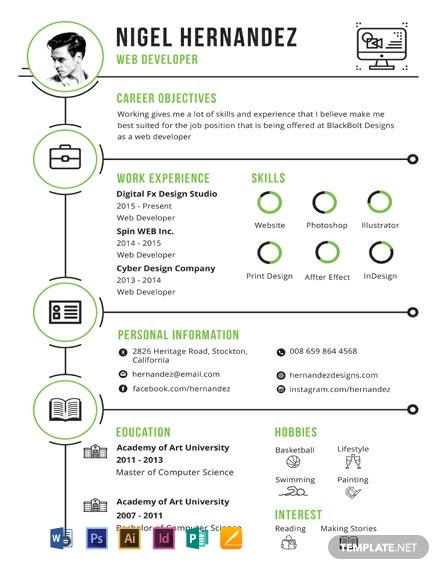
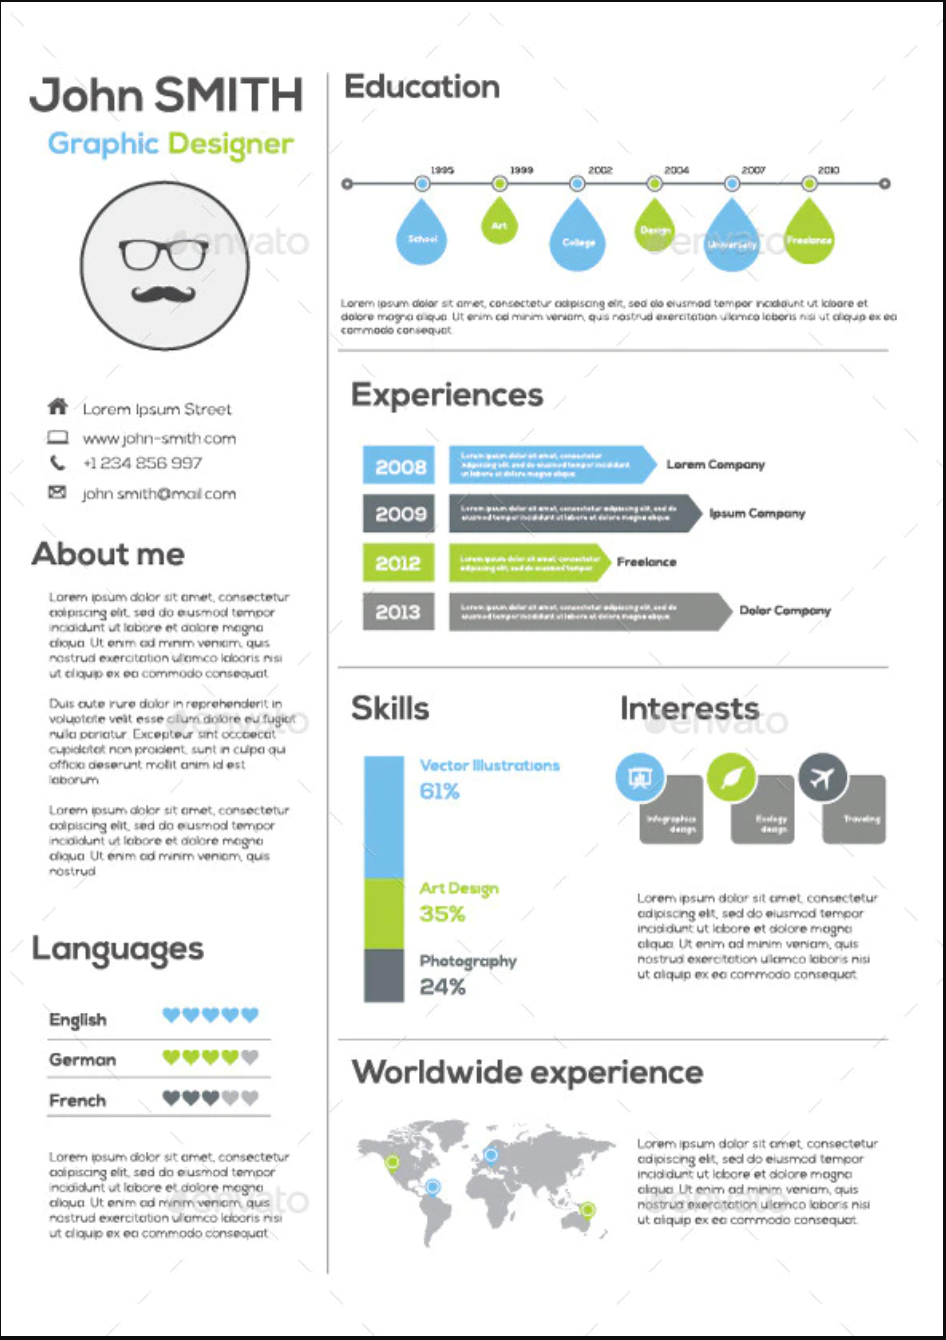
An Infographic:
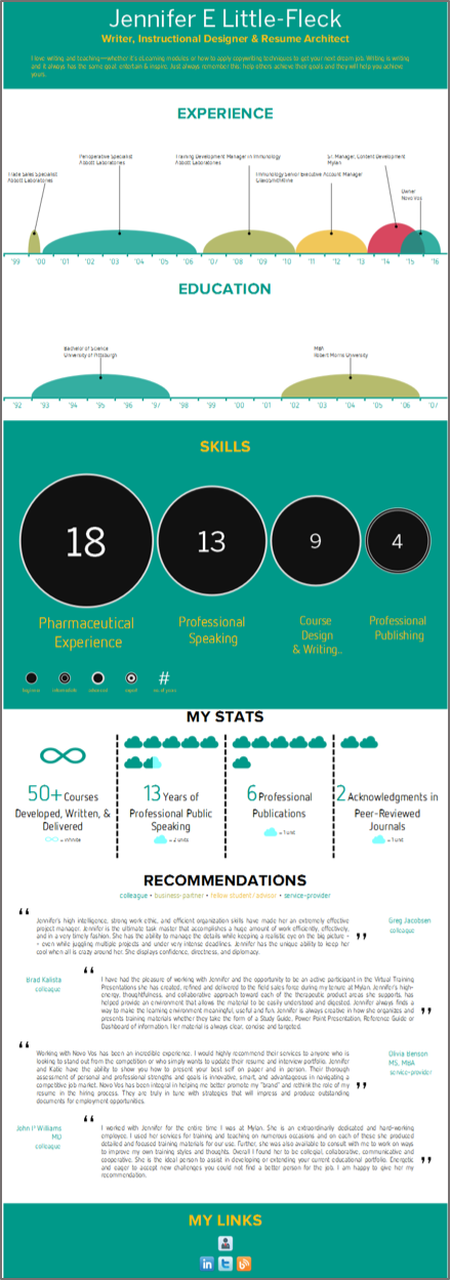
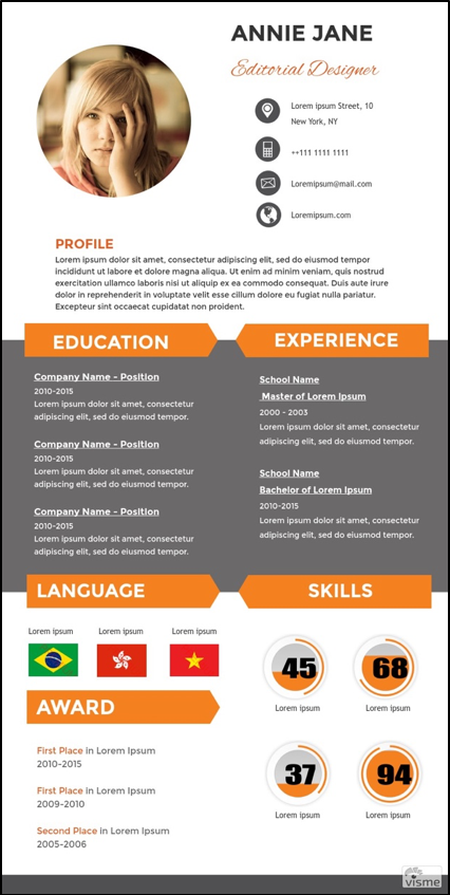
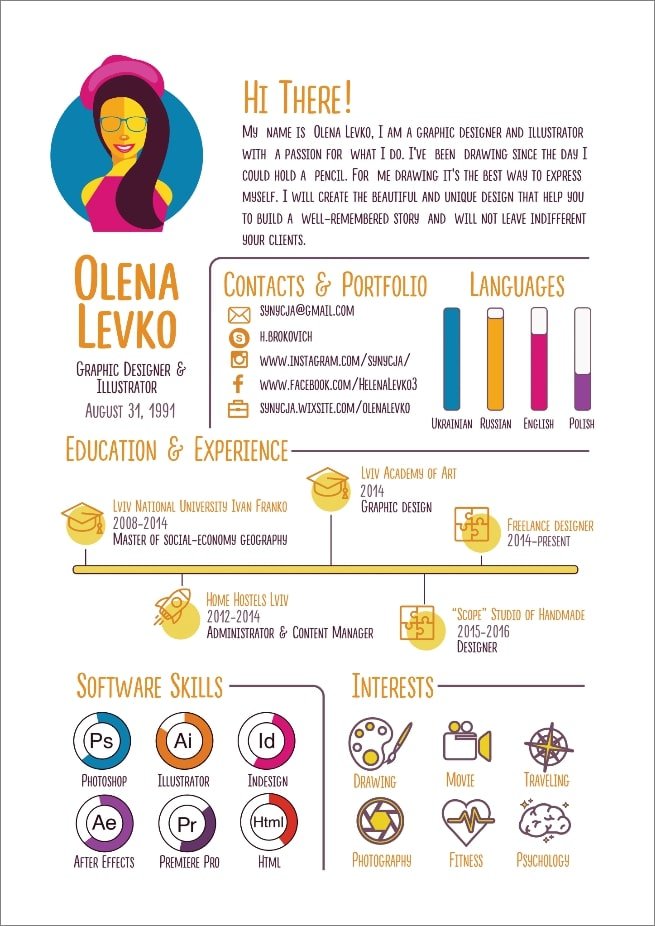
- communicates a message, tells a story - in this case a personal story
- engaging
- highly visual
- helps to explain data clearly and visually
Artists to Look At:
Paula Scher https://www.behance.net/PaulaScher
Eddie Opara https://www.pentagram.com/work
Pentagram (Design Studio) https://www.pentagram.com/work
Massimo Vignelli http://www.designculture.it/interview/massimo-vignelli.html
Saul Bass https://www.artofthetitle.com/designer/saul-bass/
Gail Anderson https://gailycurl.com/
Sylvia Harris https://www.aiga.org/design-journeys-sylvia-harris
Lesson (What are we learning by doing this project?):
Demonstrate the importance of research, sketching ideas, the use of appropriate visual references
Visual Hierarchy- creating laying out elements logically and strategically
Skillfully create images using tools in Photoshop and illustrator.
Skillfully use InDesign, Illustrator and Photoshop together
Combine multiple file types
Use color, text and images to create a visual design
STEPS:
- Using your own personal information sketch out/create a rough layout of your infographic, use provided resources, online examples and artist for inspiration.
- Create your initial layout in InDesign
- Create your design elements in Photoshop or Illustrator
- Bring Design components, images and design elements together into InDesign to make your final infographic.
Make sure to:
- use fonts that are legible
- use colors that work well together (Color Theory & color wheel relationships)
- Think about the viewer with dark text vs light text vs background
- Your images should complement and enhanc your story
- Keep layout organized, clean and concise to convey a strong clear message
Click on Visual Examples below

 RSS Feed
